


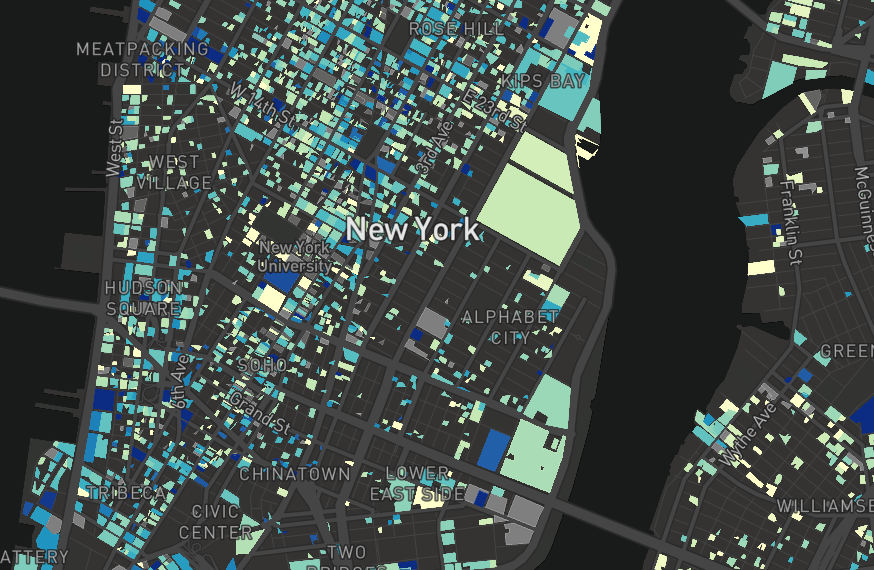
An NYU team and the Mayor’s Office of Sustainability consolidated six years of data to make an interactive map that color codes buildings based on energy efficiency.
NYU’s Marron Institute of Urban Management and the NYU Urban Intelligence Lab — led by a professor at the institute with the goal of using data to address city problems — helped create the tool. When they go on the site, a user is allowed to enter any address within the city and see a 3D model of the building and area, each building color-coded based on how energy efficient it is. Last spring, the city passed the Climate Mobilization Act, which set emissions caps for buildings larger than 25,000 square feet, requiring them to try and reduce emissions by 40% by 2030 and 80% by 2050. The new interactive map was partially created to better track how well the city and individual buildings are meeting that goal.
The tool provides additional information, like the building’s Energy Star rating — part of a program run by the U.S. Environmental Protection Agency, which rates how energy efficient a building is. It also provides a time series of energy usage from 2011-2017, a breakdown of what types of energy are being used, comparisons to similar buildings and the option to download data directly to one’s computer.
“[The goal was to] improve the transparency and openness of the energy data being collected by the city,” Associate Professor of Urban Science and Planning Costantine Kontokosta said.
Kontokosta, who works at the Marron Institute, led a team of graduate students and researchers, paired with the mayor’s office, on the project. The information shown on the performance map is collected from benchmark data required by Local Law 84. Passed in 2009, the law requires owners of buildings with more than 50,000 square feet to provide information on their energy and water consumption.
Researchers also used Pluto, a city-run database that contains information on every building in the city related to its size, age and type.
“It was just a giant Excel spreadsheet,” said Ross MacWhinney, senior advisor of the Mayor’s Office of Sustainability.
MacWhinney said he hoped the new tool would help researchers, owners and tenants looking for places to live and those just looking for more energy-use information to utilize the data they may not have had the time or adequate skills to process previously.
MacWhinney also hopes the tool becomes mainstream enough that buyers make real estate decisions based on the energy usage of buildings, pushing landlords to become more efficient to compete.
Co-president of Earth Matters and CAS senior Maddie Weikel said she was excited to use the tool herself, and hoped it would bring greater awareness to issues of sustainability.
“It’s a super cool resource for people to be more mindful,’’ Weikel said.
A version of this article appeared in the Monday, October 7, 2019 print edition. Email Julia Santiago at [email protected].