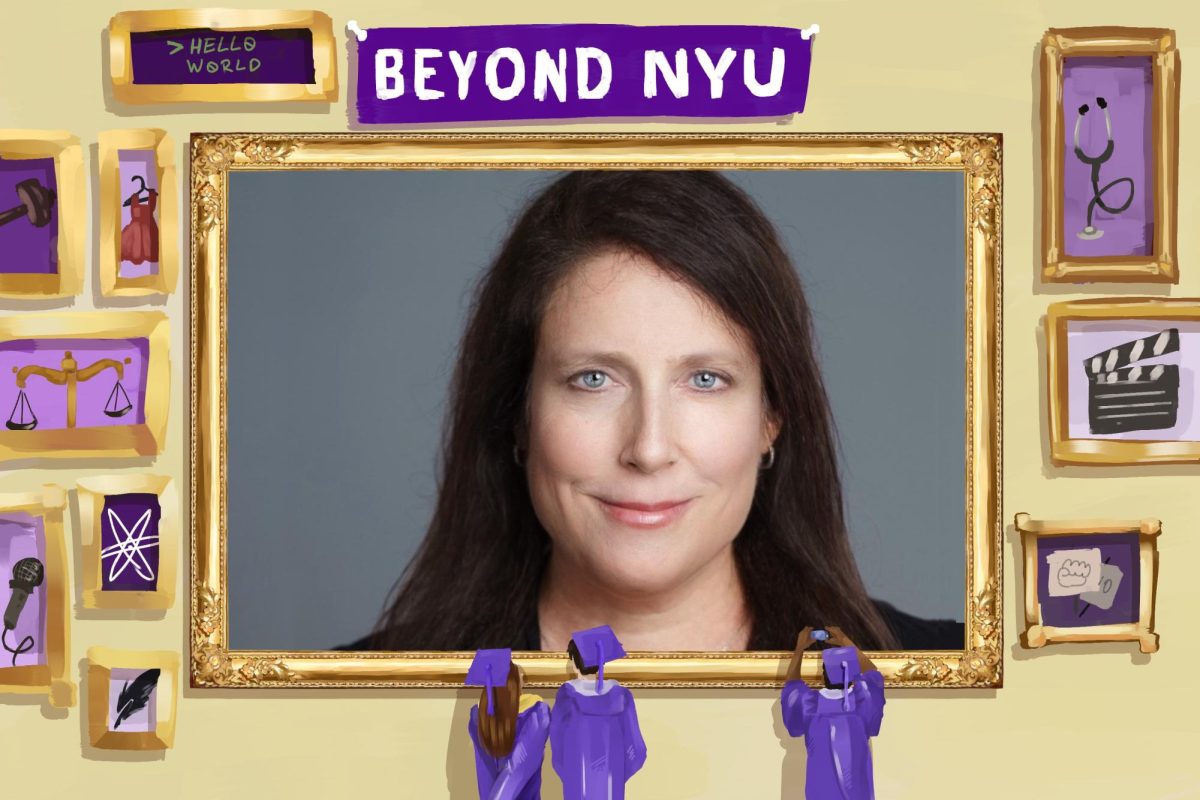
WSN sat down with Kathleen DeBoer, the deputy head of the Washington Center of the Organization for Economic Cooperation and Development, an organization that gathers economic data for the public and works with world governments. DeBoer was at NYU on March 4 to lead a workshop on how students can utilize the OECD’s online resources.
Q: Can you tell me a little bit about the organization and what you are doing at NYU today?
A: The OECD is an international governmental organization that was formed by a treaty in 1961 … Today there are 34 member countries and the OECD is a bunch of different things — it’s a forum for our member countries to come together and discuss policy, it’s a think tank for doing research on economic policy, and it’s one of the world’s foremost publishers on economic data and analysis.
I came here today as part of the OECD Student Ambassador Program … What they do is they bring OECD experts to the campus to talk about different topics. When I visit the campuses, I usually talk about OECD publications. NYU is a subscriber to the OECD iLibrary and the international energy data, so NYU has everything that we publish available to students and faculty to use. It’s an IP-based subscription, so unlimited numbers of students can be accessing, reading the same book if they want to 24/7, and we support it around the world with people like myself who answer research questions … The Student Ambassador Program is a way to get the work of the OECD a little more visible on campuses that subscribe to our data service.
Q: You were the one who started the Student Ambassador Program. What motivated you to do that?
A: Actually it’s kind of a New York City answer, because when I was a little girl I lived in New York. I thought, when I was at the OECD, that most people under 50 in the United States and Canada had never heard of the OECD. I remembered that when I was growing up in New York, I knew about the United Nations, because it had a big building and because I collected pennies for UNICEF, and all the kids collected pennies for UNICEF at Halloween, so beyond its obvious charitable mission, UNICEF is a very strong branding program for the UN … So I wanted to do something similar for the OECD, but my target was not elementary school children. I thought, at a minimum, I would like university students who are majoring in the social sciences to be aware of who we are and what we do. So that was the germ for the idea.
Q: How does the OECD go about gathering its data?
A: All of our member countries, and even quite a few of our nonmember countries that we work with, feed statistics from their national statistics bureaus to the OECD. It used to be that people had to calculate it and send it over back in the 1960s. Now we have really good, regular data feeds, so we can do the monthly economic indicators and things that we’re publishing on a monthly basis pretty quickly. Our role is to collect the data and to harmonize it, to use purchasing power parity — U.S. dollars — so that when people are doing analysis and comparing health care expenditures or educational expenditures, they can compare apples to apples.
Q: NYU operates on a subscription plan. How did that partnership get started?
A: We had a relationship with NYU, and I would say all of our subscribing universities, before we went online, when we were just selling our print reports, so NYU has probably been collecting OECD publications since the 1960s. We first went online in about 2000, so the person in my place went around and talked to those organizations that had been receiving our publications in print, and said,”‘We’re going to have this new online platform,” and then we added the interactive statistics, which is really the interesting piece because the publications are very interesting … but what we have that’s really special is all of these data points — five billion different data points — in a huge collection that can be sliced and diced in different ways, so you can go in and you can say, “I just want to know about these five countries for the period from 1970 to 1995 for these three indicators,” and you can customize that and pull it out into an Excel spreadsheet and graph it and whatever you want to do, so I think that’s the cool functionality of the website.
Q: What kind of data can be accessed on the OECD iLibrary?
A: It’s across a very broad range. The OECD works in every area that our governments work, except we don’t do anything on defense and we don’t do any faith-based issues, but we do energy, environment, education, health care, various social indicators, immigration, development assistance — all kinds of different areas.
Q: What is the idea behind providing these resources to students?
A: First of all, the data and publications are just great for anyone who’s doing a research paper in any of the social sciences. Also, if you get in there and look at the working papers, I think it gives students a great idea of how to approach some topics with and intellectual approach. In terms of the Student Ambassador Program, I’m hoping that, with the experts coming here, students will become aware of what the OECD is — maybe it’s a place they want to go work some day.
*Interview edited for clarity
Scott Mullen is a deputy news editor. Email him a [email protected].


