The Arts Issue: Venn Diagrams
April 6, 2017
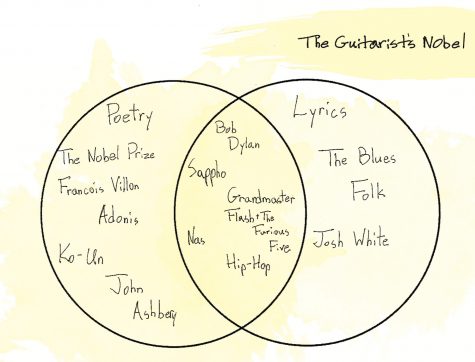
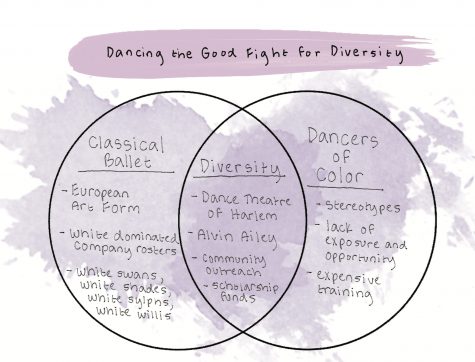
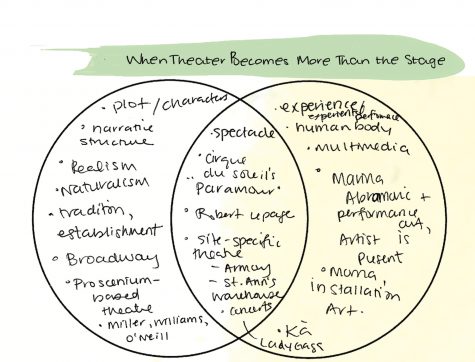
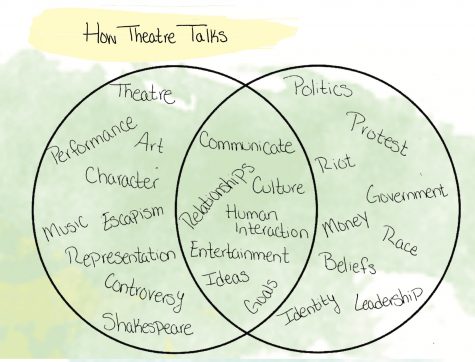
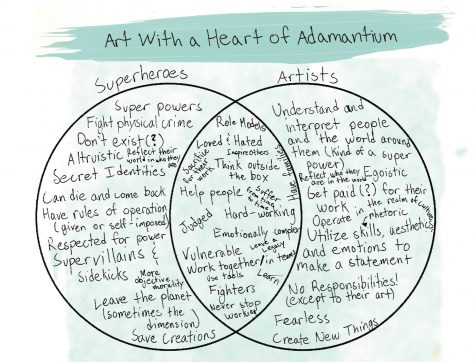
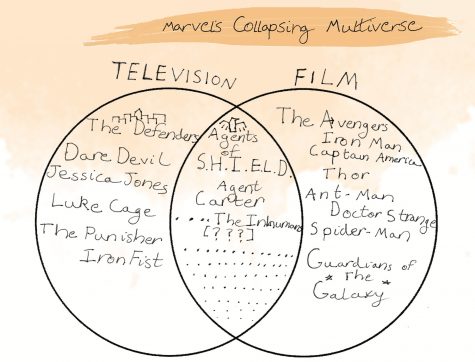
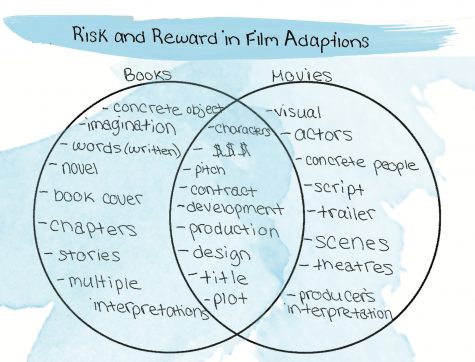
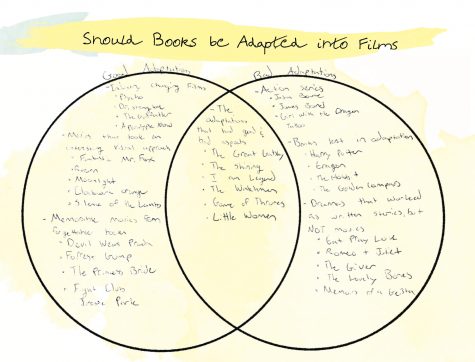
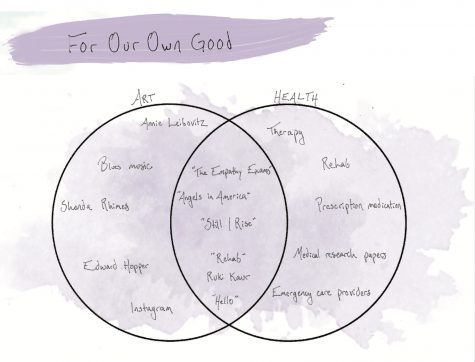
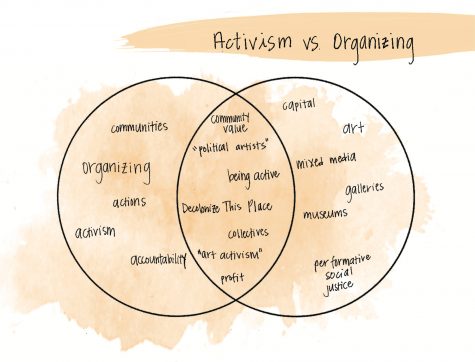
This issue is a love poem to Venn diagrams. It is an ode to intersectionality. It is a peace offering to partisanship.
I’m a very graphic learner. At the age of nine, I learned how to waterski by watching my younger sister get dragged by the boat for what her arms must have felt like were hours, until she successfully stood up behind the boat and skied. When my turn came, I was able to stand up on my first try. This isn’t because I’m a better athlete than my sister — I’m not. If I had gone rst, I’m sure the roles would have been perfectly reversed. But luckily for me and my pitiful upper-body strength, I went second. I got to watch her fall until she didn’t, and when I got behind the boat, I had already learned enough to pop right out of the water.
I fell a few minutes later, if you’re wondering.
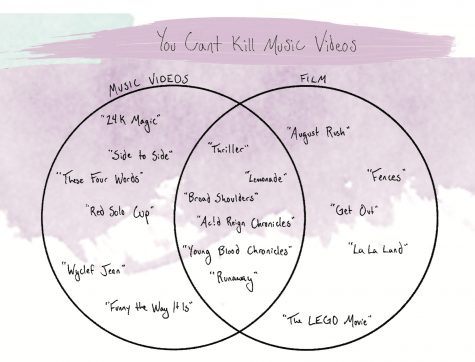
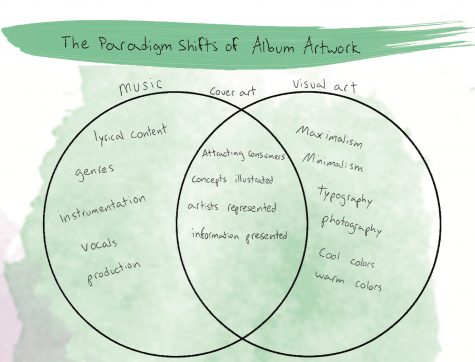
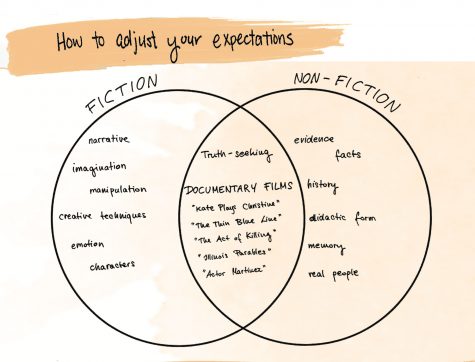
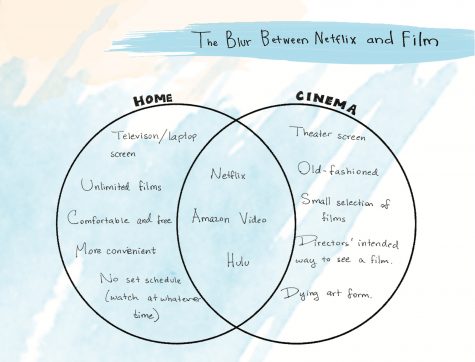
The point, though, is that visuals are a huge edu- cational aid. Venn diagrams in particular are my favorite graphic tool for displaying information — they show context and relationships in a way few other infographics can manage. Overlap is omnipresent in every part of our life, but the relative similarity be- tween things is too often forgotten. We know that learning to play an instrument aids in mathematic instruction and that learning a foreign language im- proves our ability to speak our own. Yet somehow it never occurs to us that studying theater can help us understand politics or that documentaries can teach us how to construct a narrative that says only what we want it to convey.
This issue is a series of pieces on topics near and dear to each writer’s heart. It is an exploration of how nothing is as different as you think it is and the reasons why that is. It is full of quali cations, explanations and exploration. It is a collection of passion projects — the culmination of endless drafts — too many emails full of conceptual questions and hours spent thinking really, really hard about not just art, but how we interact with it.
This is the Arts Issue: Venn Diagrams.


